Large graphs are often hard to understand or visualize.
Tabular results can be aggregated for overviews, e.g. in charts with sums, counts etc.
Grouping nodes by property values into virtual nodes helps to do the same with graph visualizations.
When doing that, relationships between those groups are aggregated too, so you only see the summary information.
This functionality is inspired by the work of Martin Junghanns in the Grouping Demo for the Gradoop Graph Processing system.
Basically you can use any (entity)<-->(entity) graph for the grouping, support for graph projections is on the roadmap.
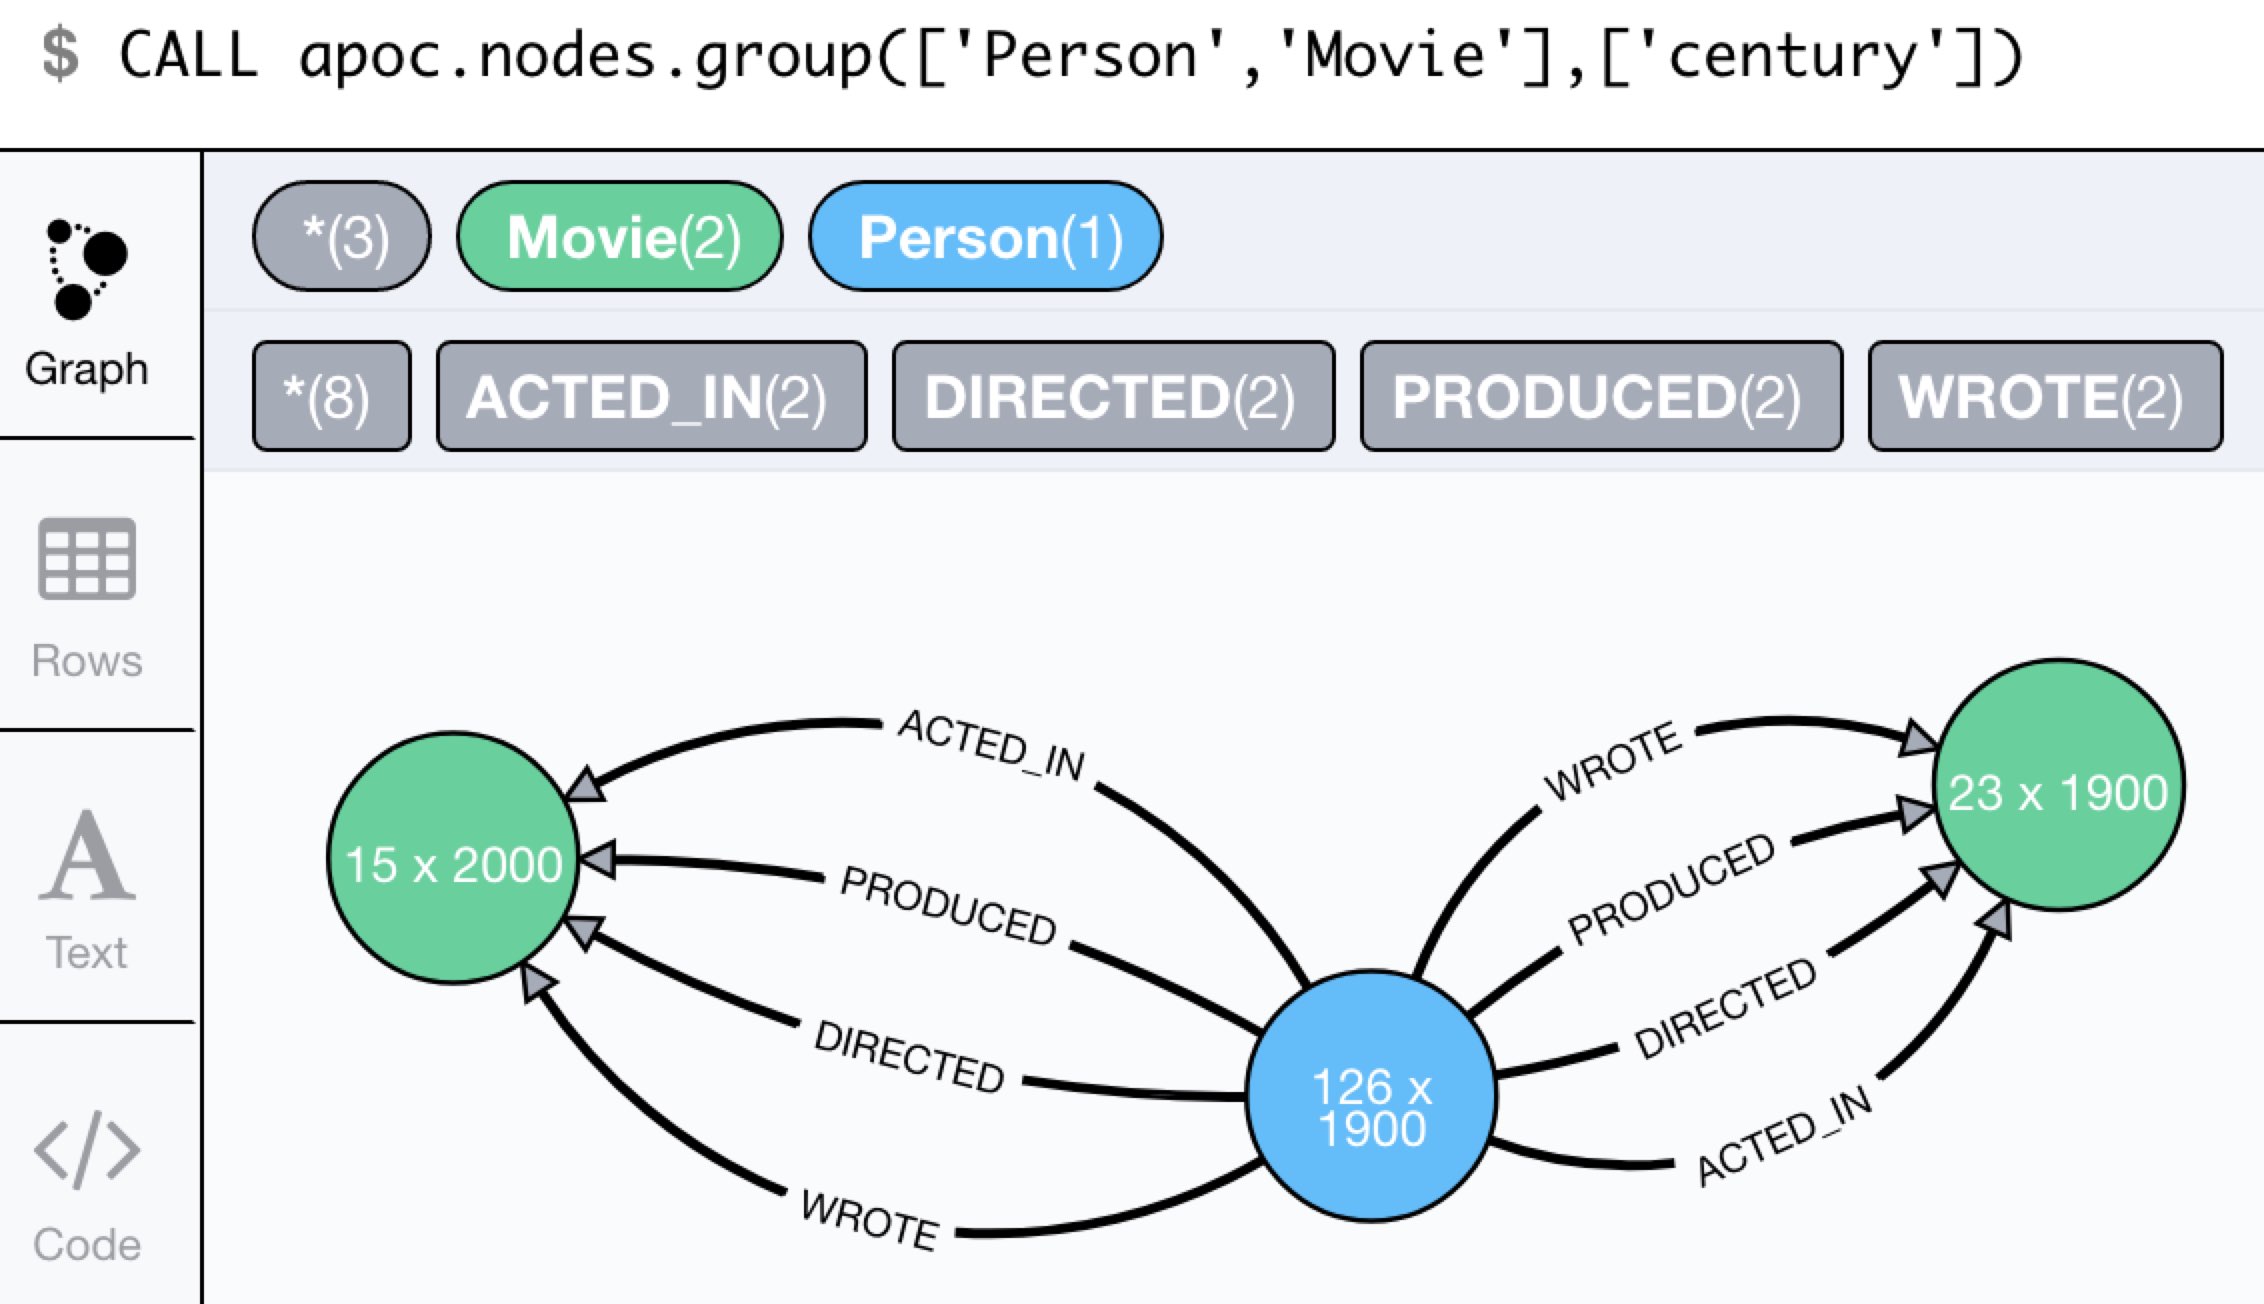
Example on movie graph.
match (n) set n.century = toInteger(coalesce(n.born,n.relased)/100) * 100;

call apoc.nodes.group(['Person','Movie'],['century']);

|
Sometimes an UI has an issue with the return values of the grouping (list of nodes and list of relationships), then it might help to run: |
call apoc.nodes.group(labels,properties, [grouping], [config])The only required parameters are a label-list (can also be ['*']) and a list of property names to group by (both for rels/nodes).
Optionally you can also provide grouping operators by field and a number of configuration options.
For grouping operators, you provide a map of operations per field in this form: {fieldName: [operators]}
One map for nodes and one for relationships: [{nodeOperators},{relOperators}]
Possible operators:
count_*countsummin/maxavgcollect
The default is: [{*:count},{*:count}] which just counts nodes and relationships.
In the config there are more options:
| option | default | description |
|---|---|---|
|
|
|
show self-relationships in resulting graph |
|
|
|
show orphan nodes in resulting graph |
|
|
|
limit to maximum of nodes |
|
|
|
limit to maximum of rels |
|
|
|
limit number of relationships per node |
|
|
|
a min/max filter by property value, e.g. |
The filter config option is a map of {Label/TYPE.operator_property.min/max: number} where the Label/TYPE. prefix is optional.
So you can e.g. filter only for people with a min-age in the grouping of 21: Person.min_age.min: 21
or having at most 10 KNOWS relationships in common: KNOWS.count_*.max:10.
Graph Setup.
CREATE
 (alice:Person {name:'Alice', gender:'female', age:32, kids:1}),
 (bob:Person   {name:'Bob',   gender:'male',   age:42, kids:3}),
 (eve:Person   {name:'Eve',   gender:'female', age:28, kids:2}),
 (graphs:Forum {name:'Graphs',    members:23}),
 (dbs:Forum    {name:'Databases', members:42}),
 (alice)-[:KNOWS {since:2017}]->(bob),
 (eve)-[:KNOWS   {since:2018}]->(bob),
 (alice)-[:MEMBER_OF]->(graphs),
 (alice)-[:MEMBER_OF]->(dbs),
 (bob)-[:MEMBER_OF]->(dbs),
 (eve)-[:MEMBER_OF]->(graphs)
CALL apoc.nodes.group(['*'],['gender'],
[{`*`:'count', age:'min'}, {`*`:'count'} ])- image
CALL apoc.nodes.group(
        ['Person'],['gender'],
        [{`*`:'count', kids:'sum', age:['min', 'max', 'avg'], gender:'collect'},
         {`*`:'count', since:['min', 'max']}]);
Larger Example
Setup.
with ["US","DE","UK","FR","CA","BR","SE"] as tld
unwind range(1,1000) as id
create (u:User {id:id, age : id % 100, female: rand() < 0.5, name: "Name "+id, country:tld[toInteger(rand()*size(tld))]})
with collect(u) as users
unwind users as u
unwind range(1,10) as r
with u, users[toInteger(rand()*size(users))] as u2
where u <> u2
merge (u)-[:KNOWS]-(u2);
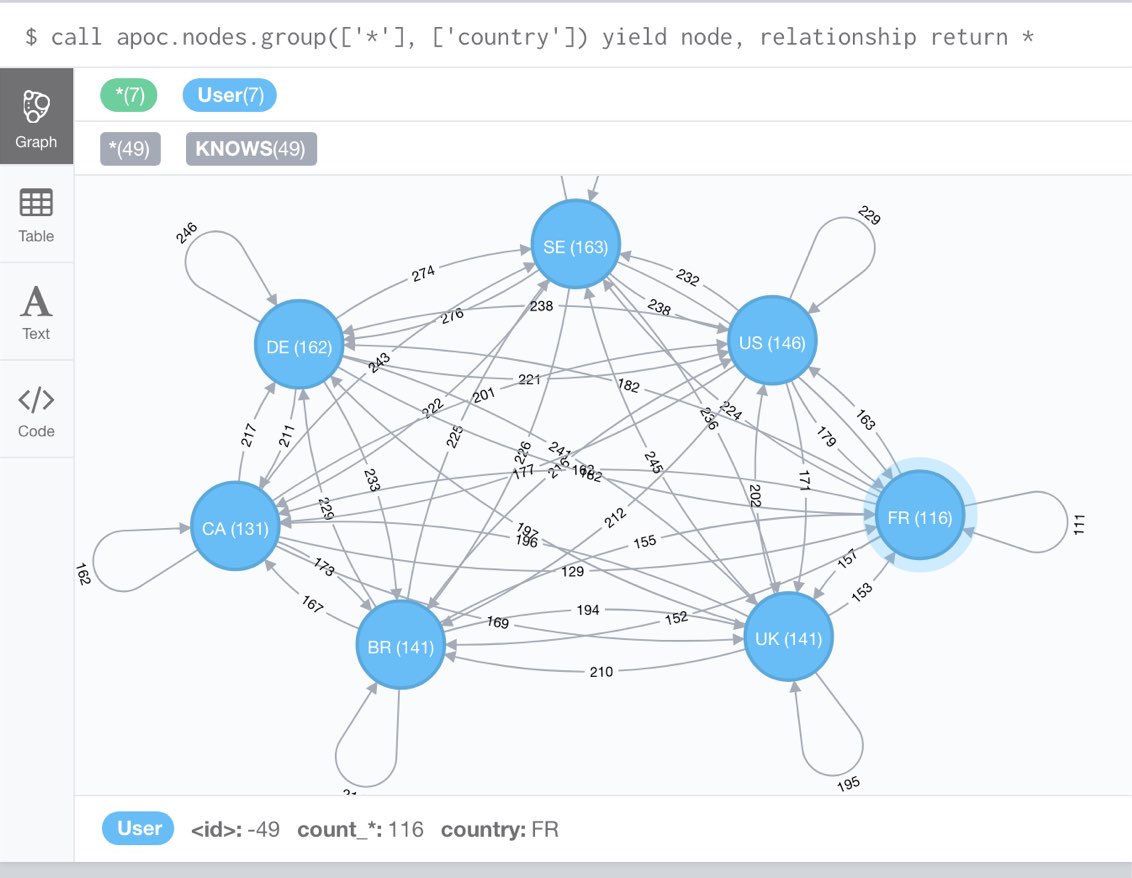
call apoc.nodes.group(['*'], ['country'])
yield node, relationship return *
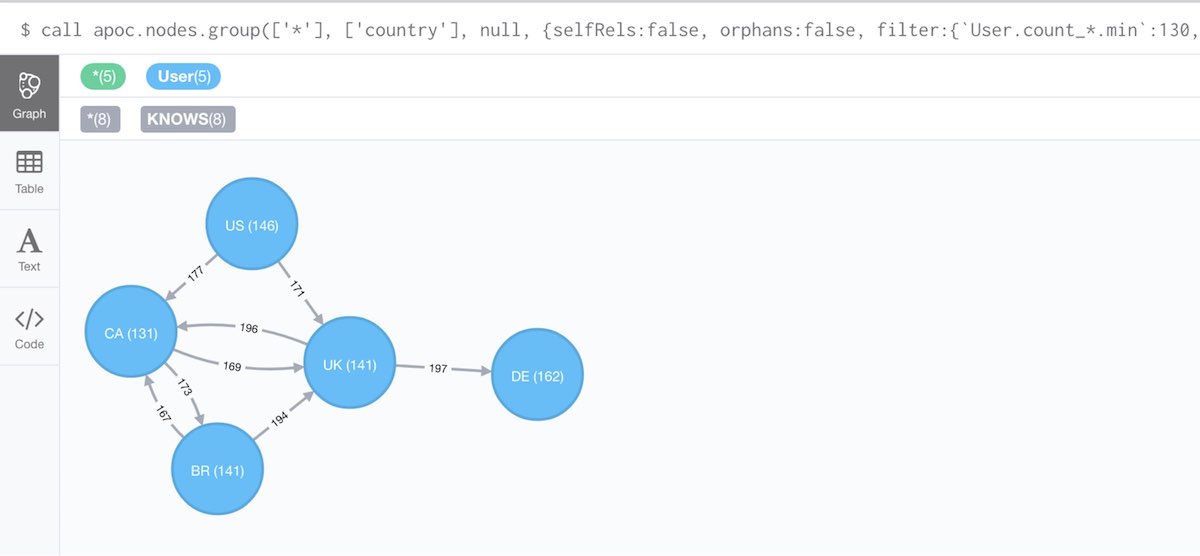
call apoc.nodes.group(['*'], ['country'], null,
    {selfRels:false, orphans:false,
     filter:{`User.count_*.min`:130,`KNOWS.count_*.max`:200}})
yield node, relationship return *
To visualize this result in Neo4j Browser it’s useful to have a custom Graph Style Sheet (GRASS) that renders the grouped properties with some of the aggregations.
node {
  diameter: 50px;
  color: #A5ABB6;
  border-color: #9AA1AC;
  border-width: 2px;
  text-color-internal: #FFFFFF;
  font-size: 10px;
}

relationship {
  color: #A5ABB6;
  shaft-width: 3px;
  font-size: 8px;
  padding: 3px;
  text-color-external: #000000;
  text-color-internal: #FFFFFF;
  caption: '{count_*}';
}

node.Country {
  color: #68BDF6;
  diameter: 80px;
  border-color: #5CA8DB;
  text-color-internal: #FFFFFF;
  caption: '{country} ({count_*})';
}